Where I illustrate debugging code for the ATmega328P using the Atmel Dragon, avr-gdb and avarice. This is a overview of a hardware debugger approach, for a more detailed view on Linux using Bloom, follow this guide.
Update (Feb 2022): I also recommend reviewing this tutorial as it is quite detailed and offers another method for using gdb. While it does use PlatformIO and VS Code, I believe its helpful to review the author’s approach to using gdb.
Sources#
- gdb Resources
- gdb Hints (from RP2040 effort)
- Outstanding Detailed Approach to using gdb with AVR Family
Introduction#
As a long-time advocate of using print statements to enable debugging, its taken me a while to use gdb for debugging. [Ed. Note: Not saying its right, just saying it is what I did. :)] Previously, I had used gdb when I was working with the pico and the RP2040 microcontroller. This approach worked extremely well as one Pico could be used as the debugger, while the second pico would be the target. Given each pico was only $4, this was a very attractive and useful setup.
The AVR family of microcontrollers requires a bit more expensive hardware. I already had an Atmel Dragon, which I bought 8 years ago for the princely sum of $75. In 2021, the Dragon is no longer available and Atmel/Microchip either offers the MPLAB Snap (proprietary interface and software) or the MKII, which is expensive (>$150). I’m exploring low cost options and will post when I have found and tested something suitable. For this post, I’ll be using the Dragon as my debugWire interface.
One last and extremely irritating issue was software updates for avr-gdb. I was getting a fair number of bugs or unexplained issues when using avr-gdb and avarice. While tracking down a couple of them, the solution was “that’s a bug, update your software.” Well, my primary Linux system is (now was) KDE Neon. Its fast, very friendly, based on Ubuntu and has worked well for about 18 months. It turns out, Ubuntu’s version of avr-gdb is version 7.7 from 2018 and attempting to build avr-gdb version 11 on my Ubuntu system failed without an obvious solution. After a little bit of research, it appeared Arch Linux was keeping avr-gdb up to date. By using Manjaro, I could retain my KDE desktop and install Arch Linux. Net, net, if you have issues, check your software version.
An example#
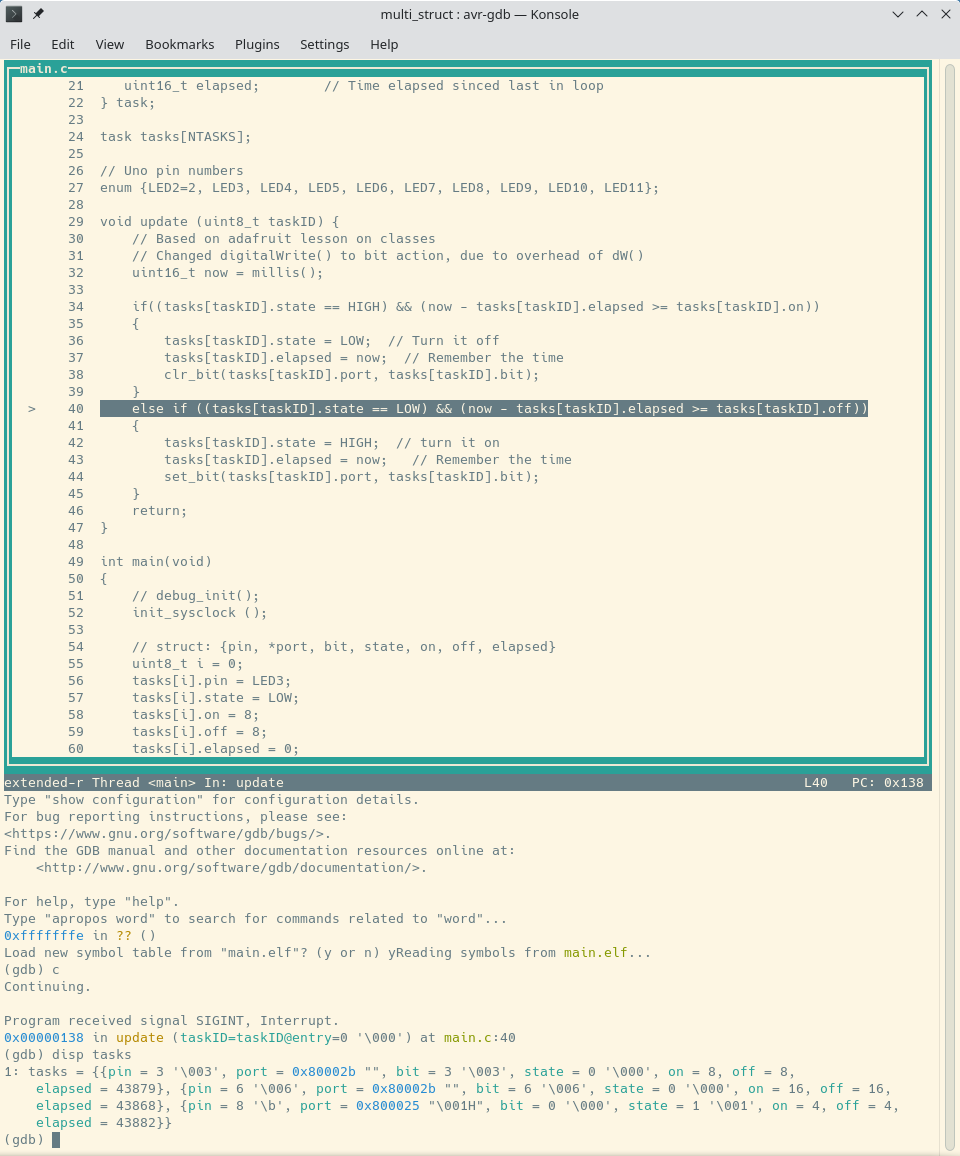
As I was working on the multitasking entry, I ran into a problem using the struct in multi_struct. The code was working well for the PORTD pins, however, it wasn’t working well for the PORTB pins. I briefly considered, adding a print statement as is my usual course of action. However due to reading (for the tenth time), Norman Matloff’s treatise on debugging, where he chastises those of us which over-rely on print statements (as in “3.1 Don’t Use printf()/cout As Your Main Debugging Devices”, I forced myself to use gdb.
The good news was I was already setup to use gdb, I simply had not been doing so. I started a gdb session, set a breakpoint right after the struct was intiallized and saw this:
Breakpoint 1, main () at main.c:90
(gdb) disp tasks
1: tasks = {{pin = 2 '\002', port = 0x80002b "\f", bit = 2 '\002', state = 0 '\000', on = 2, off = 4,
    elapsed = 0}, {pin = 3 '\003', port = 0x80002b "\f", bit = 3 '\003', state = 0 '\000', on = 3, off = 2,
    elapsed = 0}, {pin = 10 '\n', port = 0x800025 "\004H", bit = 2 '\002', state = 0 '\000', on = 8, off = 2,
    elapsed = 0}}
(gdb) c
Continuing.
Mmmm. The port numbers appear to be correct, however, I’m checking bit 1 (pin 9) and the bit is set to 2, which is pin 10. Plug the scope into pin 10, yes! it works and I’m good to go. Sigh. That was tooooooo easy!
The ability to quickly display the entire contents of the struct was invaluable. Having to do so with a print statement (easily, neatly etc) would have required much more work. Not to mention, having to enable printing in the program, adding print statements and finally removing all of the printing cruft when I was finished.
Hardware is an issue#
As mentioned above, the hardware requirement to run gdb on an AVR microcontroller is either an expensive Atmel ICE, an unavailable Atmel Dragon, or a questionable Atmel ICE clone. As I said earlier, I’ll leave this question for the time being until I can identify a suitable product. The MPLAB SNAP might work, however I haven’t found out the details to using with gdb/avarice.
Update: 12/24/2021:
- The Snap ($30) appears to require the MPLAB IDE software and after spending a morning attempting to compile/link/load a file onto my Uno via MPLAB and work with the debugger, I decided it simply wasn’t worth the effort. The tool chain I’m using (avr-gcc through avrdude) is working quite well for me and I don’t want to spend time trying to learn a bloated interface. Once again, IDE’s aren’t interesting to me.
- I did receive a few ATmega328PB XPLAINED Mini boards. I have spent a little bit of time with the board, however, it wasn’t immediately apparent how to have avarice talk to the debugging hardware. So this is another option, which is very attractive due to price ($12), however, it might require MPLAB as well. More on this when I figure out how to use or not.
- I just ordered an Atmel ICE PCBA, which is a $70 board with the same functionality as the Dragon (probably a bit more functionality!). I think this will be the best option for hardware debugging, we’ll find out when I start using it.
For now, Linux only#
The solution doesn’t require Linux, however my explanation for now, will focus on Linux as the solution. I want to know something works well and is worth the effort before I spend time on debugging for multiple platforms. The software requires both avarice and avr-gdb, both can be installed via apt or your typical Linux package manager. As mentioned earlier, the software versions for both can be dramatically downlevel, so its best to investigate prior to installation.
Hardware Debugger Process#
1. Set the debugWire fuse#
Before starting to debug, you must set up the Uno for hardware debugging. First, its important to set the fuses correctly in the ATmega328p to use debugWire. This can be done quite easily via avrdude:
# this changes the High Fuse from DA (1 in bit 6) to 9A (0 in bit 6)
avrdude -c dragon -p atmega328p -c dragon_isp -P usb -U hfuse:w:0x9A:m
Links for more information:
- Arduino / ATmega 328P fuse settings | Martyn Currey
- Howto use AVR Dragon Jtag on Linux (Avarice + avr-gdb +DDD) | Jkx@home
2. Cut the Reset trace#
As debugWire using the same pin as Reset, there is a trace on the Uno which must be cut. It’s easy and important, top is before and bottom is after.
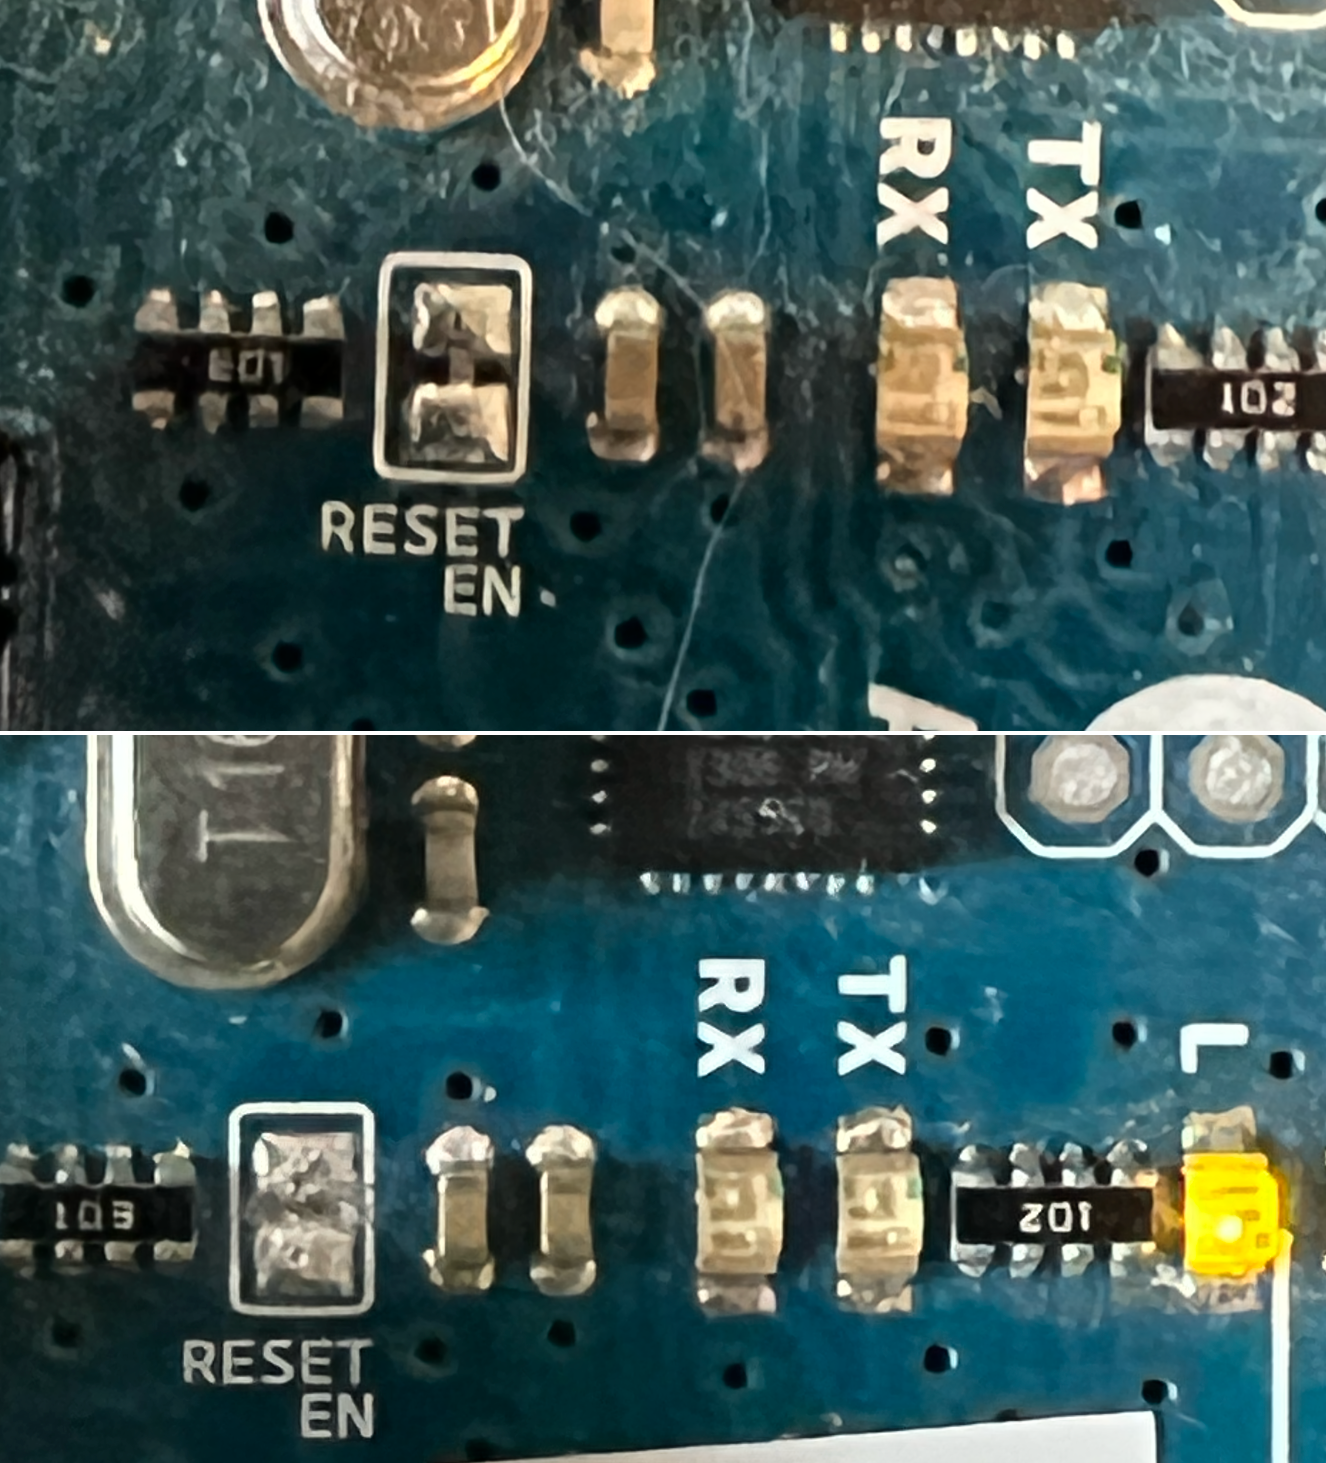
Cut the trace on RESET EN to disconnect Reset
3. Edit the Makefile for gdb#
In your Makefile, you will want to ensure your compile parameter includes “-g -ggdb” so the proper code for debugging is added to your file.
Enable gdb symbols in Makefile#
# use below to setup gdb and debugging
CFLAGS = -Og -ggdb -std=gnu99 -Wall
4. Add a .gdbinit file#
It helps to have a .gdbinit file, it eases the loading and can automate some of the more tedious setup process. I use the following with my Dragon debugging. Save it in your $home folder.:
file main.elf
target extended-remote :3333
set listsize 0

define cll
make
load main.elf
end

define mri
monitor reset init
end
5. Run avarice as the gdb server#
In your first window (off to the side), you will want to start your communications program via ICE. This window will also indicate if the connection with the target is broken, so you will want to be able to see it easily.
# in first window (only a few lines need to show)
avarice -g -w -d -P atmega328p :3333
# -g  Connect to an AVR Dragon. This option implies the -2 option.
# -w Connect to JTAG ICE mkII (or AVR Dragon), talking debugWire protocol to the target. This option implies the -2 option. See the DEBUGWIRE section below.
# -P <name>  Target device name (e.g. atmega16)
# -d  Enable printing of debug information.
6. Run avr-gdb using –tui#
In the main window, preferably full-height, in the same folder as your makefile and source. Using the option –tui, provides a decent two window display of your code and commands. Its not an IDE, however, its sufficient for my purposes.:
avr-gdb --tui
# once gdb starts up
l main
# to begin running the program
c
# to stop execution
Ctrl-C
# to set a breakpoint
br functionname | lineno
# to show values of variables etc
disp variablename
Example Display#