Where I illustrate how to setup using avr-gdb to debug code on the ATmega328P and replacing avarice with Bloom and the Atmel Dragon with the Microchip Snap.
Sources#
- gdb Resources
- gdb Hints (from RP2040 effort)
- Bloom (replaces avarice)
- Microchip SNAP (replaces the Atmel Dragon)
- Atmel-ICE Debugger more expensive version for both ARM and AVR
Introduction#
In a previous entry, I discussed using an Atmel Dragon (no longer available), avarice (an older application managing communication between the Dragon and gdb), and avr-gdb to debug a program running on a Uno (ATmega328P). My goal has been to find a suitable board which replaces the Dragon, however, at a reasonable (<$50) price point. The board would need to work with avarice or I need to find a replacement for avarice as well. This new combination needs to provide both the ability to debug as well as program the 328P.
The Microchip SNAP is that board. It supports the AVR, is supported by tools such as avrdude and Bloom and costs $34. While I had attempted to use the Microchip Snap before, I had not any luck. In my attempts to solve this problem, I ran across this link to Bloom: Enabling “AVR mode” on the MPLAB Snap. The article was great for two reasons, first, it explained why the Snap wasn’t working and provided detailed instructions as to how to fix the problem. Second, Bloom is a great replacement for avarice!!
This entry will describe how to setup and use gdb with an Arduino Uno, while this entry will provide examples of using Bloom with gdb.
Setup Debugging Process#
These steps are required to setup a debugging workflow. The process is very similar to the process using avarice and Atmel Dragon. I’ll repeat it here, as this will more than likely become the standard process.
1. Cut the Reset trace#
As debugWIRE uses the same pin as Reset, there is a trace on the Uno which must be cut. It’s easy and important, top is before and bottom is after. Doing so will change how easy it is to program the Uno, please review sources at the bottom of the page as to what will happen. I used a single edge razor to cut the trace.
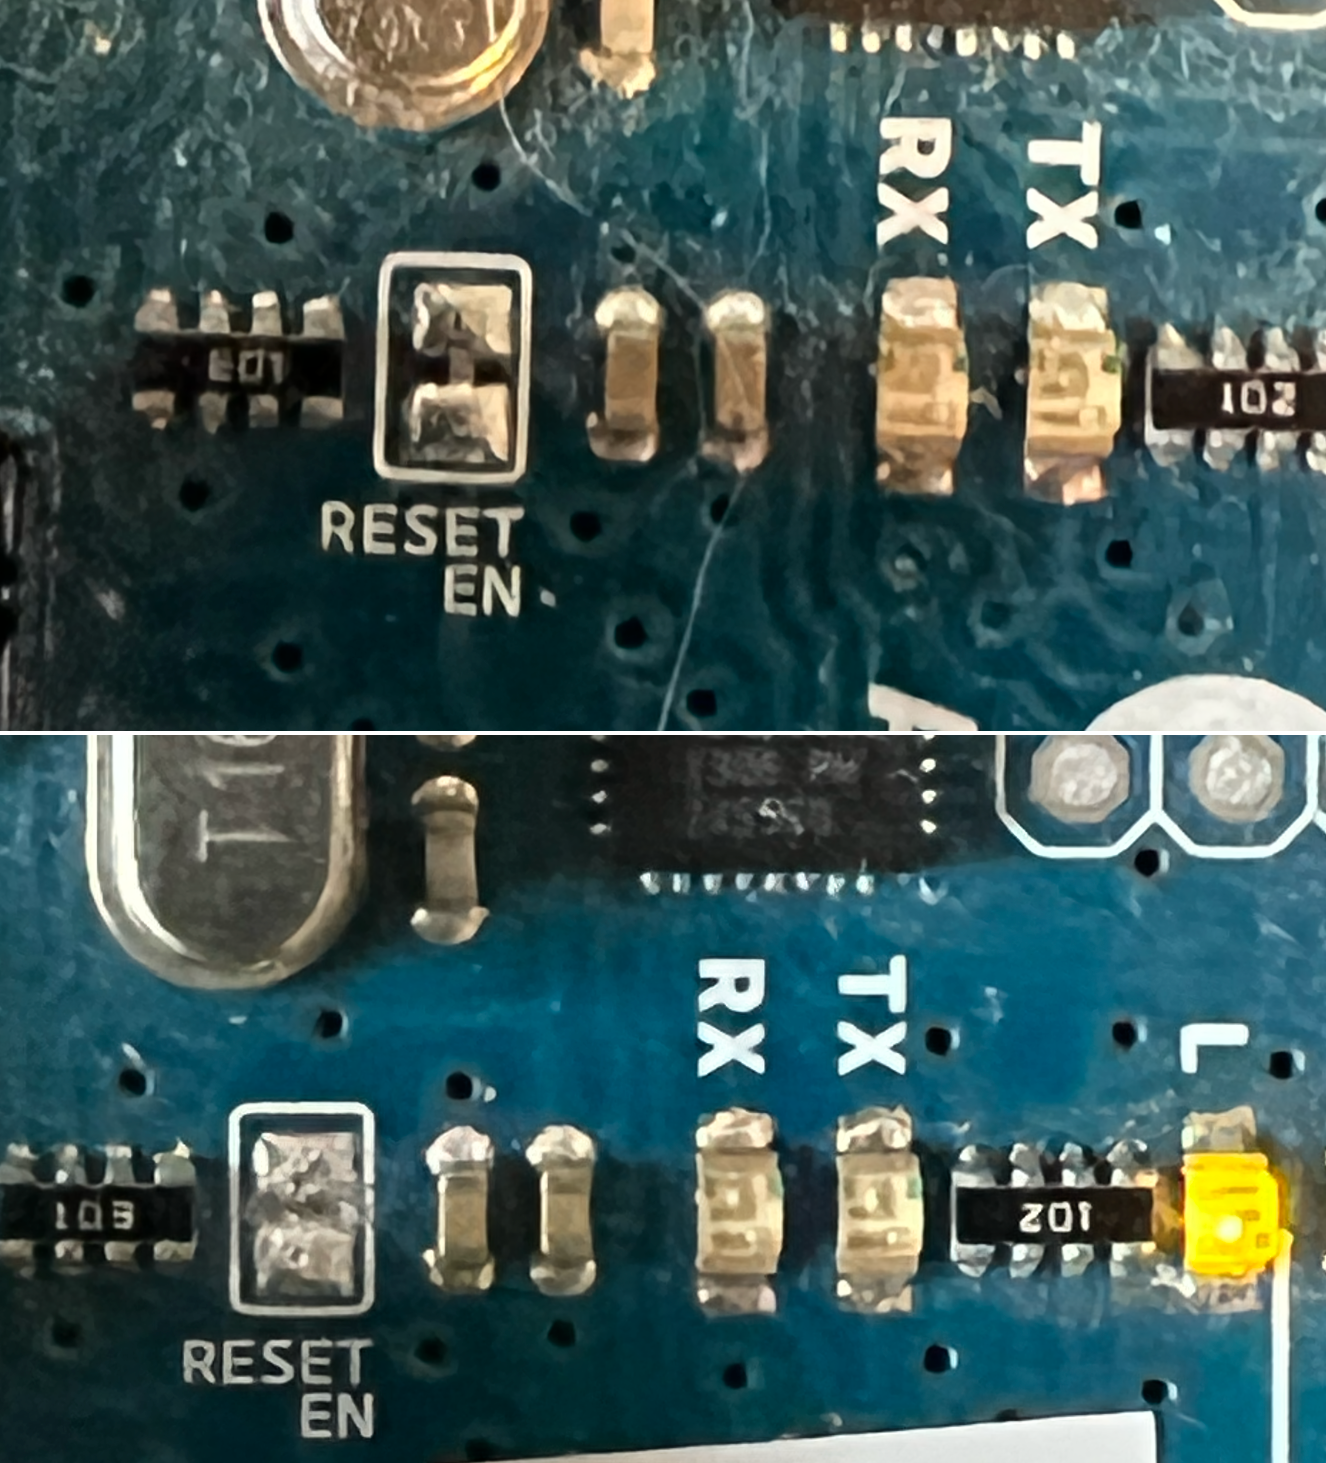
Cut the trace on RESET EN to disconnect Reset
3. Edit the Makefile for gdb#
In your Makefile, you will want to ensure your compile parameter includes “-Og -ggdb3” so the proper code for debugging is added to your file. I use the following line in my Makefile.
# use below to setup gdb and debugging
CFLAGS = -Og -ggdb3 -std=gnu99 -Wall -Wundef -Werror
4. Add a .gdbinit file#
It helps to have a .gdbinit file, it eases the loading and can automate some of the more tedious setup process. I setup loading the main.elf file and connecting to the target as well as a compile-link-load command, called cll. (More on cll later.) Save it in your $home folder:
set history save on
set history size 10000
set history filename ~/.gdb_history

file main.elf
target remote :1442
set listsize 0

define cll
make
load main.elf
mon reset
refresh
list
end
5. Setup Bloom as the gdb interface#
Per the configuration guidance, you’ll need to create a yaml configuration file. The easiest approach is to follow the instructions and make minimal changes at the start. I have my Bloom yaml configuration file at the root of AVR_C.
# do this in your project folder
bloom init;
Here is my bloom.yaml file for the Atmel-ICE:
environments:
  default:
    debugTool:
      name: "atmel-ice"

    target:
      name: "atmega328p"
      physicalInterface: "debug-wire"
      disableDebugWirePreDisconnect: false
      manageDwenFuseBit: true
      variantName: "atmega328p-pu"

    debugServer:
      name: "avr-gdb-rsp"
      ipAddress: "127.0.0.1"
      port: 1442

insight:
  enabled: true
For the Snap, I change the debugTool name to “snap”.
My Debugging Process#
As of bloom 0.10.0, this new process is awesome! A simple overview is start bloom, start avr-gdb, begin to debug, edit the errors, reload and repeat! Bloom provides a complete full-cycle method to run-edit-reload a target, which is fantastic! Let’s begin.
1. Connect Snap to the Target#
I used a AVR ISP Breadboard Adapter from Adafruit, which made the connection from the Snap SIL connector to the Uno much easier. Using the adapter, I connect 6 wires from the Snap to the breadboard like this:
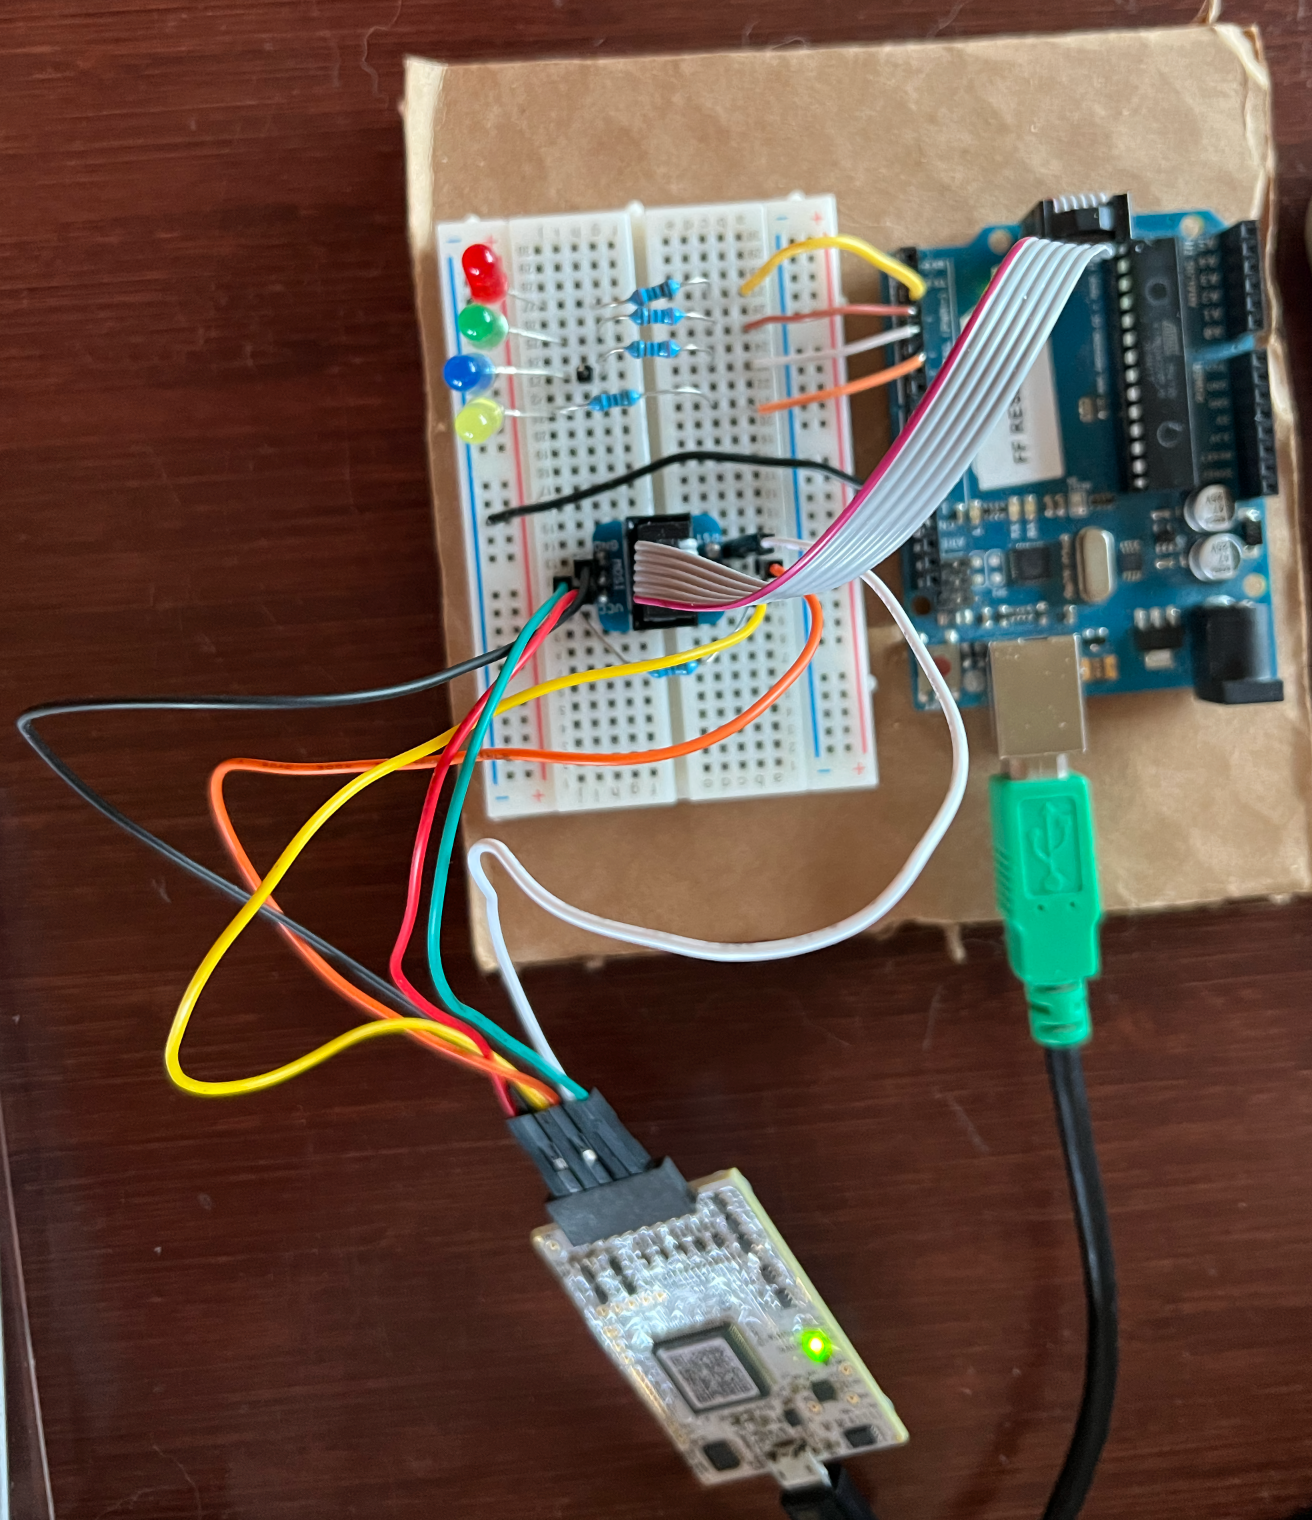
Breadboard with Uno and Snap connected
Wiring Details#
| Snap SIL | Signal/Adapter | Wire Color |
|---|---|---|
| 1 | NC | none |
| 2 | VTG | Red |
| 3 | GND | Black |
| 4 | MISO | Yellow |
| 5 | SCK | Orange |
| 6 | RESET | White |
| 7 | MOSI | Green |
| 8 | NC | none |
Then connect the adapter to the Uno using a 2x3 ribbon cable. If you don’t have the 6 pin adapter, you could use male to female dupont cable, where one end would fit the pins on the Uno and the other into the single in-line connector on the SNAP.
An alternative, albeit more expensive debugger is the Atmel-ICE Debugger. It does come with a 6-pin adapter which is easy to connect to the Uno. The raised notch on the 6-pin connector must face the Uno.
2. Start bloom#
You will want to start bloom before you start avr-gdb. Bloom doesn’t require a lot of attention, however, you will want to be able to view the window easily, as it will indicate if the connection with the target is broken. Make sure you start bloom in your project folder, as it will need to find the bloom.json file.
bloom # in project folder (in my case ~/Documents/AVR_C/)3. Run avr-gdb using –tui#
In the main window, preferably full-height, in the same folder as your makefile and source. Using the option –tui, provides a decent two window display of your code and commands. Its not an IDE, however, its sufficient for my purposes.:
avr-gdb --tui
# to show the main function in the top window (l as in list)
l
# to begin running the program (c as in continue)
c
# to stop execution
Ctrl-C
# to set a breakpoint, at a function name or set a lineno
br functionname | lineno
# to show values of variables etc
disp variablename
4. When you want to upload code#
Ok, you’ve found a bug, edited your code and now you want to reload it on to the Uno… Here’s where it gets great with version 0.10! Do all of this in the comfortable confines of avr-gdb.
(gdb) cll # remember cll from above, this will compile-link-load your file back on to the Uno
(gdb) c # begin execution to determine if fix worked!
Its not fast as a small program might take a couple of seconds to load, however it is all automatic! The cll command comes from the .gdbinit file and performs the following:
- make - recompiles all files to ensure the latest version
- load main.elf - the magic step where bloom loads the program on the Uno
- list - list the program again
- refresh - clean up tui display
Example Display#
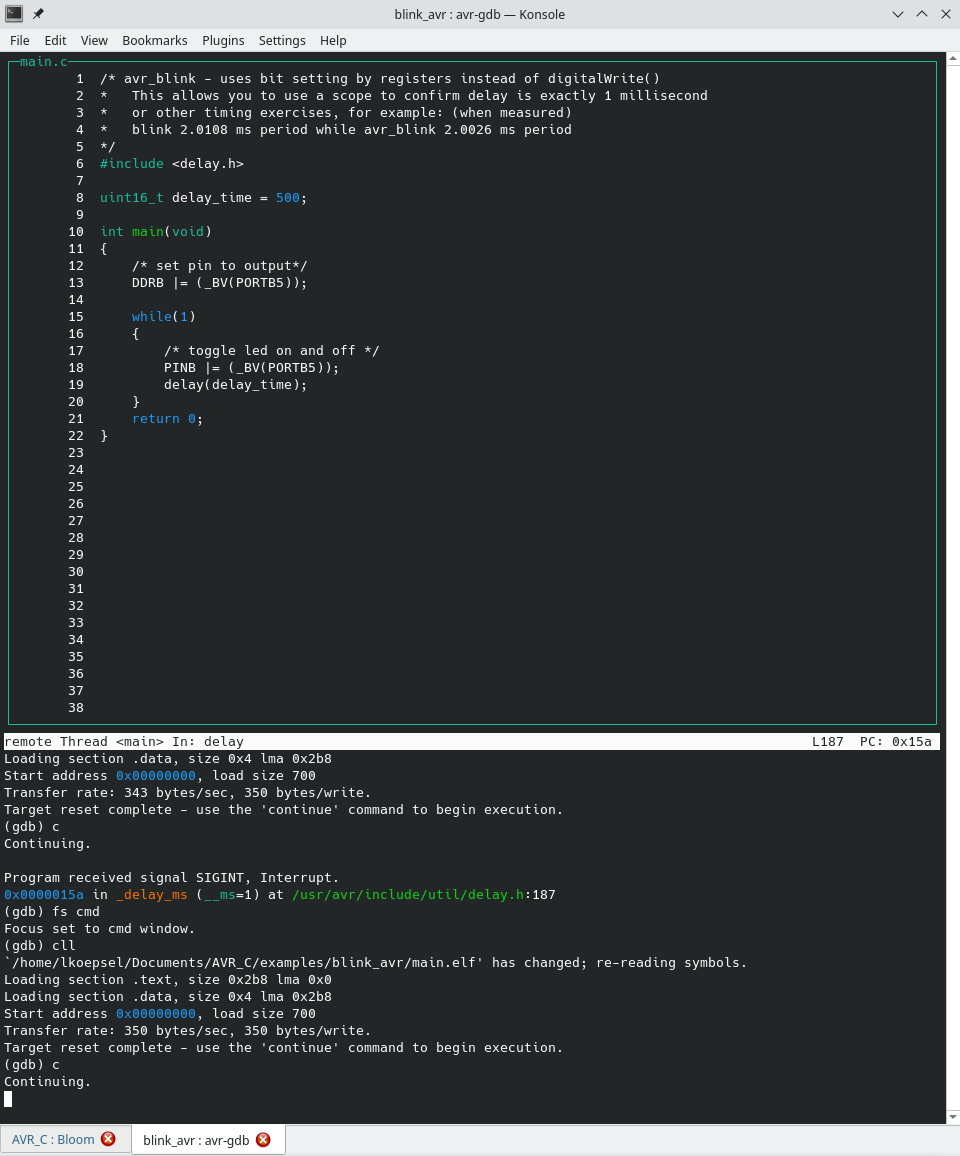
avr-gdb --tui screen using Bloom after cll command
This screenshot is of avr-gdb, immediately after executing the cll and c commands.
Screen Setup#
When I’m debugging using avr-gdb/bloom, I will have two half-screen windows open. On the left half of the screen, I have sublime text for editing the program. On the right half of the screen, I have my terminal program (Konsole), with two tabs, the one used most often shows avr-gdb –tui, while the second tab is used to start bloom. My steps are the following, edit the code in sublime text, switch to avr-gdb and run cll which is a compile-link-load of main.c, then press c to start the program.
Happy Debugging!
Additional Information#
Links for understanding fuses and debugWIRE information: